• Twitter
  • Instagram
  • LinkedIn
  • Facebook
  • Pinterest
  • Youtube
  • Rss
tmackinnon.com - Canadian Geomatics Portfolio
  • Canadian Geomatics
  • Search
  • Menu Menu

Tag Archive for: maps

You are here: Home1 / GIS and Geomatics2 / maps

Posts

Cartouche Number 95, Autumn 2018

October 20, 2018/in Publications /by Ted MacKinnon

I recently joined the executive committee of the Canadian Cartographic Association, and was asked to write a article for their Cartouche magazine. You can read the article …

Read more
https://tmackinnon.com/wp-content/uploads/cartouche95.jpg 1067 1600 Ted MacKinnon https://tmackinnon.com/wp-content/uploads/marker3.png Ted MacKinnon2018-10-20 17:13:512019-09-20 17:18:00Cartouche Number 95, Autumn 2018

Understanding the Everyday Relevance of Geographic Information

October 18, 2015/in Publications /by Ted MacKinnon

I recently wrote an article for GIM in their Perspectives Section, about why the geospatial community needs to improve people’s understanding of the relevance of geographic information and how this lead to forming GeoAlliance Canada. Read the full version here …

Read more
https://tmackinnon.com/wp-content/uploads/GIM.jpg 316 314 Ted MacKinnon https://tmackinnon.com/wp-content/uploads/marker3.png Ted MacKinnon2015-10-18 14:19:022018-12-18 14:41:31Understanding the Everyday Relevance of Geographic Information

International Map Year Celebration of Maps

May 1, 2015/in Publications /by Ted MacKinnon

I was recently invited to write an article about International Map Year and the Celebration of Maps for GIM magazine, in their Perspectives section. Read the full version here …

Read more
https://tmackinnon.com/wp-content/uploads/International-Map-Year-sq.png 225 225 Ted MacKinnon https://tmackinnon.com/wp-content/uploads/marker3.png Ted MacKinnon2015-05-01 19:55:152019-04-09 17:17:32International Map Year Celebration of Maps

Digital Terrain Modeling – Color Shaded Relief Models

March 23, 2012/in Terrain Analysis /by Ted MacKinnon

A color shaded relief (CSR) model utilizes chromo stereoscopic techniques to help emphasize the depth of the Z dimension from traditional shaded relief models that already portray the presence of an elevation difference.

Read more
https://tmackinnon.com/wp-content/uploads/LIDAR-all-hits-3D.jpg 528 703 Ted MacKinnon https://tmackinnon.com/wp-content/uploads/marker3.png Ted MacKinnon2012-03-23 14:34:332019-01-10 13:31:28Digital Terrain Modeling – Color Shaded Relief Models

Geographic Information Systems (GIS)

March 2, 2008/in GIS /by Ted MacKinnon

Geographic information systems commonly known as GIS has become a rapidly growing technological field that allows Geomatics Specialists to solve and model real world situations by incorporating digital spatial and associated tabular data. It is often defined as a comprehensive computerized information system made up of hardware, specialized software, spatial data and people to help manipulate, analyze and present the information used for storing, manipulating and analyzing spatially indexed information.
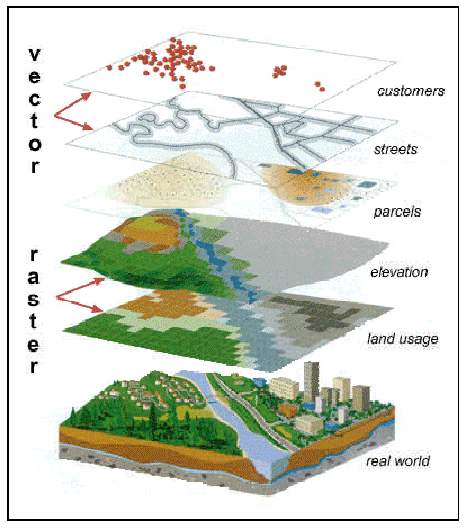
Geographic Information SystemsGIS operates on many levels and over the past decade has become an essential tool for most urban and resource planning and management organizations. On the most basic level, GIS can be used for simple digital cartography, to create various types of maps.

However the real power of GIS is through its abilities to use both spatial and statistical methods to analyze attribute and geographic information together. The end result of such an analysis can be vast amounts of derivative information, interpolated information or prioritized information.
Geographic information systems commonly known as GIS has become a rapidly growing technological field that allows
Geomatics Specialists to solve and model real world situations by incorporating digital spatial and associated tabular data. It is often defined as a comprehensive computerized information system made up of hardware, specialized software, spatial data and people to help manipulate, analyze and present the information used for storing, manipulating and analyzing spatially indexed information.

GIS technology can be used for scientific investigations, resource and utilities management, modeling, assessments, development planning, cartography and route planning and many other applications.. Some of these and other aspects of the GIS field are currently covered on this web site including projects related to spatial database modeling, Geostatistical spatial modeling, mobile mapping, cartography, and interactive web mapping.

Below are some examples of GIS from a few of the many GIS based projects that I have been involved with over the past few years. The links are to PDF versions of papers, presentations and or manuals related to GIS, I have many more, if anybody is interested in a particular topic then feel free to let me know, as I may have a document available related to that topic.

Examples of GIS

  • MacKinnon E (2004) Spatial GIS Vegetation Database and GIS Spatial Modeling at Kejimkujik National Park and Historic Site.
  • MacKinnon E (2003) Mobile Mapping Application for Updating AGRG Weather Station data
  • MacKinnon E (2003) Mobile Mapping Application – for Updating AGRG Weather Station data
  • MacKinnon E, & Murphy J. (2003) Leica GS20 Professional Data Mapper – Leica GS20 AGRG Users Guide

.

  • GIS Directory
  • GIS Dictionary
  • What is GIS – power point presentation with more information about GIS
  • GIS Theory – an Overview of GIS by The University of Melbourne
  • GIS.com GIS portal site by ESRI
  • Geomatica GeoCapacity
  • Spatial Databases – models of reality
https://tmackinnon.com/wp-content/uploads/gis1.gif 528 468 Ted MacKinnon https://tmackinnon.com/wp-content/uploads/marker3.png Ted MacKinnon2008-03-02 21:55:422014-04-24 06:07:32Geographic Information Systems (GIS)

Digital Terrain Modeling – Aspect models

March 28, 2006/in 3D Modeling, Terrain Analysis /by Ted MacKinnon

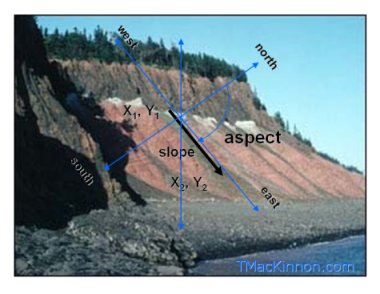
Real world example of slope and aspect

Aspect is measured in degrees (similar to a compass bearing) clockwise from magnetic north.In digital terrain modeling the Aspect of a surface refers to the direction (azimuth) to which a slope face is orientated. The aspect or orientation of a slope can produce very significant influences on it, so it is important to know the aspect of the plane as well as the slope. Together the slope combined with the aspect of the surface can virtually define the surface plane completely in digital terrain modeling.

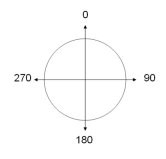
Aspect is measured in degrees (similar to a compass bearing) clockwise from magnetic north. A surface with 0 degrees Aspect would represent a north direction, an east facing slope would be 90 degrees, a south facing slope would be 180 degrees and a west facing slope would be 270 degrees.

Aspect map derived from a digital elevation model of Lismore, Nova Scotia

The example shown to the left (for larger image click here) is a raster aspect model of Lismore, Nova Scotia was derived from a digital elevation model (DEM) calculated using PCI Geomatica remote sensing software. It is represented with a grey scale color ramp and helps to indicate what direction slope faces are orientated.

The image above is of an actual bedrock cliff with some technical information embedded onto the image to help better understand slope and aspect relationships. The black arrow represents the slope or the measured angle that the rock is dipping towards.

The aspect is the orientation that the arrow (slope) is pointing with respect to North, therefore the aspect for this slope would be in an easterly direction and often represented by 90 degrees. The blue arrows represent the X, Y and Z dimensions that the combination of both the slope and aspect would use to represent the terrain features.

https://tmackinnon.com/wp-content/uploads/aspect-image.jpg 294 380 Ted MacKinnon https://tmackinnon.com/wp-content/uploads/marker3.png Ted MacKinnon2006-03-28 14:08:392012-03-26 19:18:24Digital Terrain Modeling – Aspect models

Example of an Aspect Map

March 26, 2006/in 3D Modeling, Terrain Analysis /by Ted MacKinnon

The image below is an Aspect Model that I derived from a digital elevation model (DEM) of Lismore, Nova Scotia. The aspect values of the slopes of the DEM are represented in the model by a 0-255 grey scale color ramp. Click here to learn a little more about Aspect Models and how the image below was created.
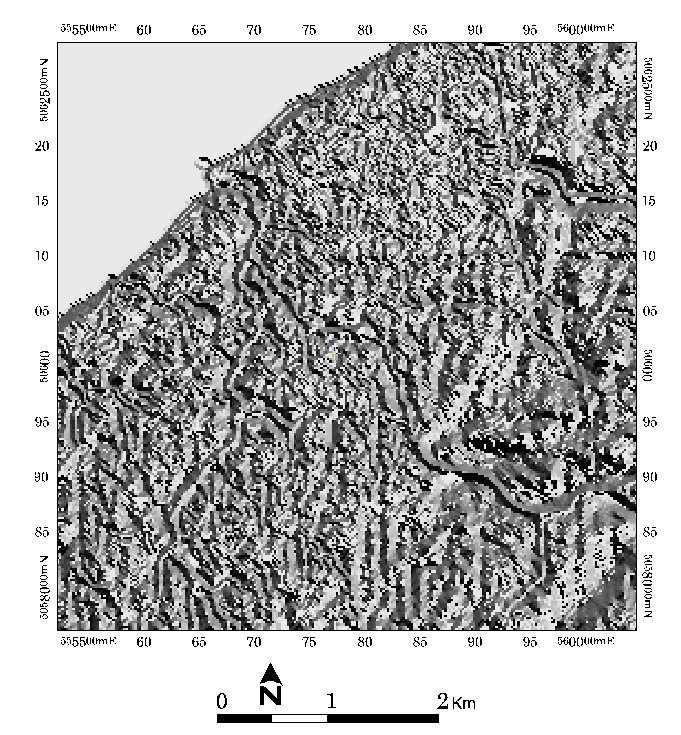
Aspect map derived from a digital elevation model of Lismore, Nova Scotia

https://tmackinnon.com/wp-content/uploads/marker3.png 0 0 Ted MacKinnon https://tmackinnon.com/wp-content/uploads/marker3.png Ted MacKinnon2006-03-26 19:06:022012-03-26 19:08:23Example of an Aspect Map

Slope

February 27, 2006/in 3D Modeling, Terrain Analysis /by Ted MacKinnon

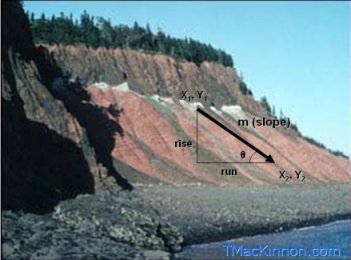
image of a cliff demonstrating Slope calculations

The slope or the gradient of a straight line within a Cartesian coordinate system is known as the measure of how steep a line is relative to the horizontal axis.

In calculations; it is generally represented by the letter m, and defined as the change in the Y coordinate divided by the corresponding change in the X coordinate, between two distinct points on the line (X1, Y1 and X2, Y2). Since the Y axis is vertical and the X axis is horizontal by convention, slope is often referred to as the rise over the run or the change in the vertical coordinates, divided by the change in the horizontal coordinates.

Basically, the larger the slope value, the steeper the line is. A horizontal line has a slope of 0, a 45 degree line has a slope of 1, and the slope of a vertical line is typically undefined. In trigonometry two lines are considered to be parallel if and only if their slopes are equal or if they both are vertical and therefore undefined. Two lines are considered to be perpendicular if and only if the product of their slopes is -1 or one has a slope of 0 and the other is vertical and undefined.

There are two common ways to describe slope. One method is to use the angle of the slope in degrees (0 to 90), and the other is to represent the slope as a percentage (0 to 100). Expressing slope as a percent is common but can be confusing because a percent slope can be greater then 100%. A 100% slope is actually only a 45 degree angle due to the fact that the rise and run of a 45 degree angle are equal and when divided always equals 1 and when multiplied by 100 will equal 100%.
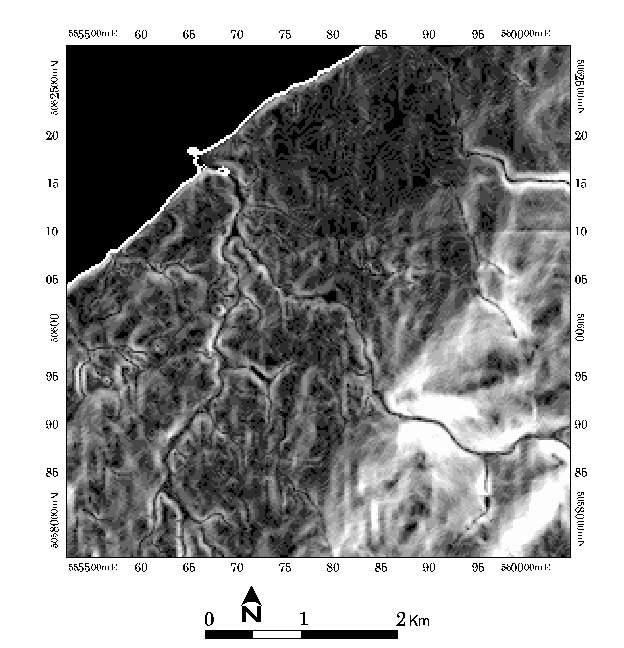
Slope Model / Map for Lismore, Nova ScotiaIn terrain modeling we generally model an entire surface and not just one line so we need to calculate the slope of a best fit surface plane (which is made of lines). Because the terrain model is usually continuous across the entire surface, it is important to be able to calculate how to represent grid cells (or pixels) when going from one elevation to the next. To do this we generally need to know the aspect or the direction that the surface plane is sloped as well. Together the slope combined with the aspect of the surface can virtually define the surface plane completely.

In the example shown to the left, a slope map of Lismore, Nova Scotia was derived from a digital elevation model (DEM) calculated using PCI Geomatica remote sensing software. It is represented with a grey scale color ramp therefore the color white represents a 0 slope and the shades of grey increase through to black which represents an undefined slope. The majority of slopes for this map do not exceed 17 degrees (except for vertical slopes) as this is a relative low lying area of Appalachian terrain.

The image above and to the right is of an actual bedrock cliff with some technical information embedded onto it so it may be used to help better understand slope. The black arrow represents the slope or the measured angle that the rock is dipping towards. The slope in the image would be 45 degrees approximately so the slope would be 1 or 100%. The rise and the run of a slope with a 45 degree angle will always equals 1, thus when multiplied by 100 to calculate percent slope will equal always equal 100%.

https://tmackinnon.com/wp-content/uploads/slope-image.jpg 260 351 Ted MacKinnon https://tmackinnon.com/wp-content/uploads/marker3.png Ted MacKinnon2006-02-27 13:39:102012-03-27 14:16:01Slope
Page 1 of 212

Pages

Cartography, GIS, and the Art of Map Making

April 11, 2014/by Ted MacKinnon

Cartography
The Art and Science
of Map Making

  • Home
  • GIS
  • Cartography
  • Remote Sensing
  • LiDAR
  • Geomatics Resources
  • Canadian Open Data

Cartographic Map Design

Cartography or map making is the practice of creating maps or visual representations of a surface, as you would see it from above it.

Cartography, GIS, and map making - a custom graphic map of Pictou County, Nova Scotia

Traditionally maps have always been created using pen and paper, but since the introduction and wide spread use of geographic information systems (GIS) better computers, and the Internet cartography practices have evolved more into a variety of digital formats.

Most maps today are now generated using map software that falls into one of three main types; GIS, CAD, or specialized map graphic design software.

These days many consider cartography to be more precise, thanks to advancements in computer technology, satellites and GPS. Earlier maps, though, were created by hand using simple instruments with mathematical equations.

Ptolemy, a Greek cartographer from the 14th century derived a projection consisting of set of geographical coordinates to map the Roman Empire. Eratosthenes, another Greek cartographer was the the first person to determine the circumference of the Earth. Many centuries later, and still some of their techniques are still used by cartographers in map making.

My cartography experience began during my time studying geology at Acadia University. I was involved in several geology field mapping courses creating geology maps. Then while studying remote sensing techniques at COGS, I started to use various GIS and graphic design software packages to create mapping products. These days I create maps on a daily basis for the majority of projects that I am involved in.

Download Canadian OpenData from over 100 different Sources


“In cartography, as in medicine, art and science are inseparable. The perfect map blends art and science into an effective tool of visual communication.” ~ Dr. Keith Harries

Cartography - vintage Fredericton New Brunswick map


Cartography | Basic Overview

A map utilizes a variety of colors, symbols, and labels to represent actual features and provide information on their existence, location, and the distance between them. It can also indicate variation in terrain, heights of natural features, and the extent of vegetation cover.

Maps often function as visualization tools for spatial data which is acquired from actual measurements and can be stored into a database, from which it can be later extracted for a variety of purposes. Current trends in this field are moving away from traditional methods of map making and toward the creation of increasingly dynamic, interactive maps that can be manipulated digitally, often known as Web GIS.

Most maps will contain a scale parameter that will allow the user to convert distance on the map to distance on the ground or vice versa. The ability to determine distance on a map, as well as on the earth’s surface, is an important factor in GIS and the spatial relationships between features. Other important key elements or features that you should find on a good map would be a title, a data frame, a legend, a scale bar, a north arrow, and citation information such as the date, the creator, projection, overview map location etc.


Some Examples of Cartography and Digital Mapping Products

  • MacKinnon E (2000)  8th International Marathon Canoe World Championship Site Map – designed for the International Marathon Canoe World Championship that were held in Dartmouth, Nova Scotia
  • MacKinnon E (2003)  AGRG Annapolis Valley LIDAR Ground Validation Campaign – presented at the Geomatics Atlantic 2003 Conference held at Acadia University in Wolfville, Nova Scotia and posted at the Applied Geomatics Research Group seminar room in Middleton, Nova Scotia
  • MacKinnon E (2003)  Jeremy’s Bay Campground, Kejimkujik National Park – campground was surveyed in 2003 and mapped for Parks Canada  MacKinnon E (2003)
    Jim Charles Loop of Jeremy’s Bay Campground, Kejimkujik National Park
     – campground was surveyed in 2003 and mapped for Parks Canada  MacKinnon E (2003)
  • New Brunswick High Precision Network and AGRG 2003/2004 LIDAR Zones – presented at the Geomatics Atlantic 2003 Conference held at Acadia University in Wolfville, Nova Scotia and used during the ground validation survey in New Brunswick

Generic selectors
Exact matches only
Search in title
Search in content
Search in posts
Search in pages
Filter by Categories
2004 NB LIDAR project
3D Images
3D Modeling
AGRG
Arizona
Awards
Canada
Cartography
Central America
Data Integration
Digital Elevation Models
EASI Scripts
ERDAS
Flood Modeling
GIS
GPS
Granada
Image Gallery
International Travel
LIDAR
Managua
Masaya
Mobile Mapping
New Brunswick
Newfoundland
Nicaragua
North West Territories
Northern Ontario
Nunavut
Ontario
Other
Past Projects
PCI Geomatica
photogrammetry
Publications
RADARSAT
Remote Sensing
Resources
Rio Blanco
RS Software
Satellites
Spatial Modeling
Terrain Analysis
TITAN
Travel Blog
USA
Washington - DC
Web Sites Portfolio
Free Canadian Geospatial Resources
Download Canadian Open Data
Browse Canadian GIS Jobs
Canadian Geomatics News
Proud Supporter of the Royal Canadian Geographical Society
Proud to be a member of the Royal Canadian Geographical Society's College of Fellows
Generic selectors
Exact matches only
Search in title
Search in content
Search in posts
Search in pages
Filter by Categories
2004 NB LIDAR project
3D Images
3D Modeling
AGRG
Arizona
Awards
Canada
Cartography
Central America
Data Integration
Digital Elevation Models
EASI Scripts
ERDAS
Flood Modeling
GIS
GPS
Granada
Image Gallery
International Travel
LIDAR
Managua
Masaya
Mobile Mapping
New Brunswick
Newfoundland
Nicaragua
North West Territories
Northern Ontario
Nunavut
Ontario
Other
Past Projects
PCI Geomatica
photogrammetry
Publications
RADARSAT
Remote Sensing
Resources
Rio Blanco
RS Software
Satellites
Spatial Modeling
Terrain Analysis
TITAN
Travel Blog
USA
Washington - DC
Web Sites Portfolio

Canadian Cartographic Association 

The Canadian Cartographic Association (CCA) was founded in 1975 with the aims of promoting interest in maps and related cartographic materials, furthering the understanding and knowledge of maps, and advancing education in cartography through the use of maps.Canadian Cartographic Association

Three decades later, the aims remain the same, although the CCA now considers its constituency to extend beyond Cartography to embrace closely related fields such as GIS. Membership is open to anyone with an interest in any aspect of mapping and members are drawn from the ranks of government, industry, and education, and from the general public.

At the 2018 CCA annual general meeting I was elected to the position of Vice President. Membership is open to anyone in the geospatial community, both individuals and organizations interested in cartography. The core group that makes up the CCA area great bunch of people that are constantly encouraging more people to get involved. Click here, to find out how to join the CCA

Cartographic Section

Much of the material in the cartography part of my website originated from my original online portfolio that I used to further my career.

Since then it has morphed into more of a resources section related to remote sensing that includes helpful information about cartography and maps, including various related books, images, maps, data and much more.

(Use the search tools to find remote sensing related material on this site or browse some of the latest additions using the links below).



Converting Decimal Degrees to Degrees Minutes Seconds

December 29, 2017/by Ted MacKinnon

Advocate Harbour Color Shaded Relief Map

June 15, 2015/by Ted MacKinnon

UTM Rows and Zones

February 17, 2014/by Ted MacKinnon

Converting between UTM, MTM and LAT/LONG

July 5, 2013/by Ted MacKinnon

Map of Jeremys Bay Campground

May 23, 2011/by Ted MacKinnon

UTM Zones in Google Earth

June 21, 2008/by Ted MacKinnon

LIDAR GPS Validation

April 22, 2007/by Ted MacKinnon

Kejimkujik National Park and Historic Site ortho photos

May 30, 2005/by Ted MacKinnon
Load more
Share this entry
  • Share on Facebook
  • Share on Twitter
  • Share on Pinterest
  • Share on LinkedIn
  • Share on Reddit
  • Share by Mail
https://tmackinnon.com/wp-content/uploads/Custom-Map-Art-of-Pictou-County-Nova-Scotia-ft.jpg 350 500 Ted MacKinnon https://tmackinnon.com/wp-content/uploads/marker3.png Ted MacKinnon2014-04-11 10:44:132019-12-12 18:57:20Cartography, GIS, and the Art of Map Making
Generic selectors
Exact matches only
Search in title
Search in content
Search in posts
Search in pages
Filter by Categories
2004 NB LIDAR project
3D Images
3D Modeling
AGRG
Arizona
Awards
Canada
Cartography
Central America
Data Integration
Digital Elevation Models
EASI Scripts
ERDAS
Flood Modeling
GIS
GPS
Granada
Image Gallery
International Travel
LIDAR
Managua
Masaya
Mobile Mapping
New Brunswick
Newfoundland
Nicaragua
North West Territories
Northern Ontario
Nunavut
Ontario
Other
Past Projects
PCI Geomatica
photogrammetry
Publications
RADARSAT
Remote Sensing
Resources
Rio Blanco
RS Software
Satellites
Spatial Modeling
Terrain Analysis
TITAN
Travel Blog
USA
Washington - DC
Web Sites Portfolio
Free Canadian Geospatial Resources
Download Canadian Open Data
Browse Canadian GIS Jobs
Canadian Geomatics News

Remote Sensing

  • Advocate Harbour Color Shaded Relief MapAdvocate Harbour Color Shaded Relief MapJune 15, 2015 - 2:01 PM
  • Geomatics Acronyms and AbbreviationsGeomatics Acronyms and AbbreviationsMay 30, 2014 - 6:44 AM
  • 3D Modeling with High Resolution LIDAR3D Modeling with High Resolution LiDARApril 24, 2014 - 1:42 PM
  • Color shaded reliefs utilize chromo stereoscopic techniques to help emphasize the depth of the Z dimension from traditional DEMsColor Shaded Relief ModelsJuly 3, 2012 - 9:31 AM

Cartography

  • Converting Decimal Degrees to Degrees Minutes SecondsConverting Decimal Degrees to Degrees Minutes SecondsDecember 29, 2017 - 8:36 AM
  • Advocate Harbour Color Shaded Relief MapAdvocate Harbour Color Shaded Relief MapJune 15, 2015 - 2:01 PM
  • map showing UTM zones in CanadaUTM Rows and ZonesFebruary 17, 2014 - 9:28 AM
  • Canadian using a UTM mapConverting between UTM, MTM and LAT/LONGJuly 5, 2013 - 11:42 AM
Proud Supporter of the Royal Canadian Geographical Society
Proud to be a member of the Royal Canadian Geographical Society's College of Fellows

GIS

  • Converting Decimal Degrees to Degrees Minutes SecondsConverting Decimal Degrees to Degrees Minutes SecondsDecember 29, 2017 - 8:36 AM
  • Geomatics Acronyms and AbbreviationsGeomatics Acronyms and AbbreviationsMay 30, 2014 - 6:44 AM
  • Spatial Database Modeling of forest stands in Kejimkujik National ParkGeomatics – GIS data base modelingMarch 5, 2014 - 11:30 AM
  • GIS Spatial Modeling - GIS Model of Average Annual Precipitation of the Annapolis Valley, Nova ScotiaGeomatics – GIS Spatial ModelingOctober 30, 2013 - 9:56 AM
© Copyright tmackinnon.com
  • Twitter
  • Instagram
  • LinkedIn
  • Facebook
  • Pinterest
  • Youtube
  • Rss
  • Home
  • GIS and Geomatics
  • Contact
Scroll to top