Geologic Application of RadarSat S2 Mode Data
The following is the content from a joint paper that I co-authored with Blair Sangster while at COGS in March of 1999. The project also included a presentation that was presented at the Center of Geographic Sciences Auditorium, in Lawrencetown Nova Scotia and a large plotted poster.
Introduction
In 1995 the Canadian remote sensing society welcomed RadarSat, a microwave sensing satellite with HH polarization. RadarSat was launched and achieved a near polar orbit of 768 km. The sensor is capable of operating in seven different beam modes. This ability to change beam modes provides Canadians a number of choices in terms of the variation in resolution (10 to 100 km), scene area (50 x 50 to 500 x 500 km swath) and the incidence angles used (10 to 60o). RadarSat International offered new technology that could provide complete global coverage with the versatility to support various specific observation requirements.
RADARSAT images can provide geologists with an exceptional and correlative data source with respect to geological contacts, structures, and lineaments. This project is an attempt to provide some distinct examples of various geological structures in Nova Scotia that can easily be detected using RADARSAT imagery. Since Nova Scotia is a well-mapped and explored area, geological and geophysical data is easily accessible to accompany the radar data. RADARSAT imagery is especially appropriate for mapping in unexplored or unmapped regions, because of the geological structure, surficial bedrock and lineaments information it provides. By studying the geological structures of a known area, such as Nova Scotia, one can become more familiar with the skills and techniques needed to discover geologic situations in areas of unmapped regions using radar.
Radar
Radar images are single frequency C-band representations that highlights variations of roughness, relief, and moisture levels in the terrain. The images are monochromatic (black and white) representations and do not contain the multi-spectral component necessary for creating false-color composites (such as LandSat TM). The brightness of a pixel is directly related to the reflectance of the object that it portrays. RADARSAT contains one spectral band that is derived from the portion of the spectrum which the human eye is unable to detect. This microwave wavelength (5.6cm) is capable of imaging the earth during virtually any atmospheric condition (day or night), to provide a clear monochromatic image of the Earth’s surface.
The radar image is a result of microwave energy that is transmitted down to the surface from the satellite and reflected directly back to the sensor upon contact. The amount of energy returning to the sensor (known as backscatter) is dependent upon the topography, roughness, and dielectric properties (moisture). Areas of an image with low backscatter appear dark (such as water), while areas of high backscatter appear as light gray levels approximating white shades. By interpreting the various gray tones, textures and patterns, the user can detect information regarding to the regions geologic lithology and structure.
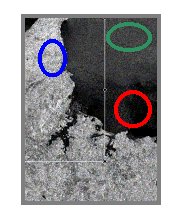
Figure 1. The backscatter, (energy returned to the sensor) is dependent on the material in which it contacts. Topography, roughness and dielectric properties all effect the amount of backscatter that will be experienced by the sensor. The pixels within the red circle represents water, where most of the energy is reflected and it will appear black (no or little return). Turbulent water returns some backscatter in an image with a steep incidence angle (such as S2) and is represented in the green circle. The blue circle represents a rough topographic region that reflects a large amount of the original energy allows the image to appear white (diffuse reflectors) in this area.
RADARSAT is an active sensor, which sends its own signals down to the surface and processes the returned signals. The wavelengths are longer and are better suited for atmospheric penetration, collecting data regardless of the conditions. This ability of RADARSAT provides the user with a significant advantage when it comes to viewing under various atmospheric conditions.
 Figure 2. The active beam is transmitted down to the surface (A) and is returned to the satellite (B) once the target is reached. The backscatter is dispersed in various directions (C) depending on the substance of the material and the incidence angle of the beam mode.
RADARSAT is different from optical sensors such as LandSat or SPOT by the type of data that it acquires and the method in which it is collected. Optical systems are passive systems, they rely on reflected energy (sunlight) in order to obtain imagery. Unlike RADARSAT, optical sensors are unable to collect data in various atmospheric conditions such as cloud cover, fog, dust, or smoke . The short wavelengths of optical bands are similar in size to atmospheric particles and water droplets and are thus reflected and deflected when interrupted in the atmosphere. This same principle called Raleigh scattering cause the suns blue light 400nm l to bounce about in the atmosphere making the sky appear blue. RadarSat’s longer wavelength of 5.6cm is long enough to never be impeded by atmospheric conditions.
RadarSat is equipped with seven different beam modes (containing 35 different beam positions in all), which offers image resolutions ranging from 8 to 100 meters and is designed to be capable of using various incidence angles (10-600).

Figure 3. The various beam positions available from RADARSAT allow the user to obtain data with various resolutions and incidence angles.
Radar is sensitive to the detection of lineaments, joints, faults and shear zones because of its side-looking configuration (SAR), and can provide detailed information about the subtle changes a terrain’s relief. It brightens the sensor-facing slopes of ridges while accentuating the lee slopes with a shadow giving the user a clear view of the relief. With some knowledge of the study area, and the other data sets such as geophysical, geological and DEM’s, the geologist can draw some accurate geological assumptions.
INTERPRETATIONS
Lineaments
RADARSAT highlights linear elements (known as lineaments) of an image which are not parallel to the look direction. Lineaments may be human-induced, geomorphological or structural in origin. Power-lines, railroads and roads are some basic examples of man-made lineaments. Eskers, drumlins, sinkholes, and dunes are some examples of geomorphologic lineaments. Lithological changes and various tectonic and seismic activities (e.g. faults) are represented by structural geologic lineaments.
Bedrock faulting can produce a unique set of surficial characteristics that may provide information about the type of fault and it’s relative age. Other examples of faults are often indicated by sharp breaks in the topography or the lithology of the area. This is often easily detected from the radar image but can be more difficult if there is a lack of topography or a large thick layer of overburden covering the various lithological units in the area.
Examples of Lineaments due to faulting can be easily detected from a radar image of the Arasaig, Nova Scotia area, located within the Antigonish Highlands. The lithology in this area consists of Ordovician Volcanic rocks overlain by rich fossiliferous sedimentary rocks deposited during an Early Silurian sea. The Silurian and the above Devonian sandstones are highly displaced in many areas due to the subsequent faulting that occurred fromthe faulting of the Hollow fault.

Figure 4. The Major faults of the Antigonish Highlands (shown in red over the geology map) are easily detected in the corresponding S2 RADARSAT image (located on the left).
Cape Breton Island is a petrologist or geologists paradise, it is part of the Appalachian Orogen that can be divided into four distinct tectonostratigraphic terranes (the Blair River Inlier, the Aspy terrane, the Bras D’or terrane,
and the Mira terrane. The lithological rock units range from highly volcanic, various metamorphic facies and an abundance of sedimentary suites. The terrain of the island is highly varied and ranges from the steep Highland
mountainous regions to the north to the lower highly glaciated areas to the south.
The Aspy terrane is known to consist of Ordovician to Silurian volcanic and sedimentary rocks containing large regions of units that were metamorphosed during the Silurian. The SAR ability of RADARSAT allows the geologist to depict changes in the lithology easily, especially when the terrain is varied in height such as the Cape Breton Highlands.
The user should note that with SAR foreshortening, shadow and layover often occurs and can an inexperienced user a false impression of the topography in a region. The layover, foreshortening and shadow can make it difficult
to estimate the dip of the slope. In some cases, foreshortening can enhance slight changes in shapes and can be an efficient method for joining particular segments of a fault or shear zone into one local lineament.
The Bras D’or terrane contains low-pressure metamorphic and sedimentary rocks with large regions of subduction zone related dioritic, granodioritic and granitoid plutons that are typical of an Andean type continental margin.
This terrane was thrusted over the Aspy terrane which is located to the north of it. The boundary between these two Appalachian terranes is a major mylonitic shear zone known as the Eastern Highlands shear zone.
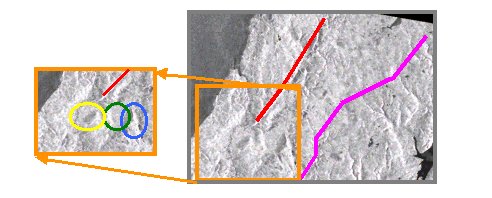 Figure 5. The Aspy terrane and the Bras D’or are easily separated after detecting the Eastern Highland Shear Zone (approximated by the purple line). The shear zone leads to other faulting that is easily detected on the image (shown by the red lines)The separation
between the two terranes can easily be traced through Cape Breton and can be later detected in Newfoundland. Change in lithological units can easily be detected and can lead to future investigation of not so well mapped areas. The green circle represents a large unit of undifferentiated gneiss and schist derived from the Basement Complex and the George River Group. The Blue circle represents a Cambrian granitoid ridge. The yellow area is a basin that consists of various Carboniferous Horton Group sedimentary
rocks.
Exposed Bedrock
RADARSAT images can provide information on exposed bedrock, areas of vegetation, and areas with various amounts of overburden. The dominant criteria determining how a given outcrop will appear in a radar image is its surface texture. Rocks tend to erode distinctly different from one another, resulting in a unique roughness that can be easily distinguishable in most radar imagery due to the heterogeneous amount of backscatter.
RADRARSAT has the ability to image different rock units is a result of its (SAR) side-looking configuration, which highlights topographic relief. Geological units can be identified by the unique textures, shapes, and gray tones in the radar imagery. Geologists can then use the image to detect small-scale geologic structures, erosion patterns, and subtle relief features.
Areas that lack vegetation like in the Canso area allow the surficial bedrock to be easily detected on a RADARSAT S2 image. The granites are easily distinguishable from the Cambrian-Early Ordovician Meguma Group metamorphic rocks. Adding a DEM and geology to the image enhances the already identifiable rock units on the radar image.
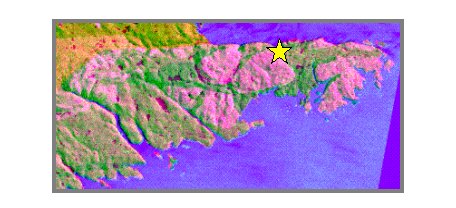
Figure 6. The Early Carboniferous-Devonian granite plutons out-cropping in the Canso area (represented by the yellow star) are easily enhanced by adding a DEM and geological bedrock map to
the radar image.
Structural and Lithological differences
The Windsor Group Carboniferous sedimentary units, located in the Whycocomagh area are part of a structural complication known as an extensional basin created by conjugate normal strike-slip faulting. The pull apart extensional basin is often referred to as a graben structure. The faulting of the crustal blocks are often due to movement in the lithosphere and usual occur in unstable rock units that are easier to break such as Carbonate rocks.
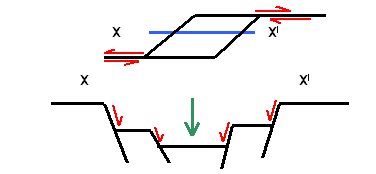
Figure 7. The schematic plan-view and cross section displays the basic structure of an extensional pull apart basin. The double conjugate normal faults come together to create what geologists refer to as a graben.
The Graben structure discussed above and shown by the cartoon in figure 7 is clearly visible on the RADARSAT imagery. In the same image a synformal structure is easily detected. The highly deformed and folded Carboniferous sedimentary rocks with exposed vertical or reclined limbs are good evidence for further study of the tectonic regional geology in this area.
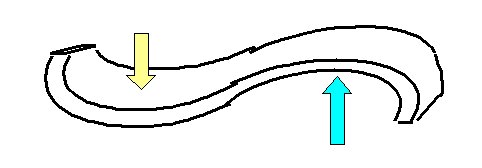
Figure 8. A schematic cross section sketch demonstrating the basic structure of an antiformal (blue arrow) and a synformal fold (green arrow). The RADARSAT image in figure 9 circled in blue is believed to be a synformal structure that would have originated from a structure similar to this one.
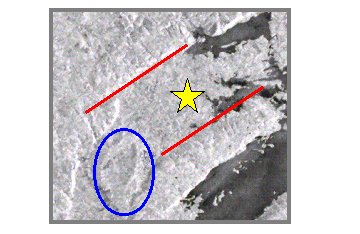 Figure 9. The synformal discussed above is shown inside the blue circle. The star represents the center of the extensional pull-apart basin (with the limbs represented by red lines) also discussed above.
Speckle
RADARSAT imagery is commonly characterized by the presence of a “salt and pepper” granular like appearance known as speckle and often occurs in most of or throughout the whole image. This is mainly caused by the sensor, which is transmitting numerous pulses for a given region at the same time. The pulses are then reflected from the many scattering points within the resolutioncell (pixel). The continual motion of the satellite causes each received pulse to be slightly shifted and can result in a speckle appearance.
The presence of speckle in the image can decrease the resolution and reduce the amount of detail that the human eye can depict. The amount of speckle can be controlled during the initial image processing stage. The user should be careful that important information is not lost when attempting to remove speckle from an image.
Speckle Removal
The most common method of removing speckle is by filtering the image. This technique utilizes various methods of pixel averaging in order to smooth out the salt and pepper appearance from the image. There are many filters designed to reduce the speckled appearance in the images. The important thing to note when selecting a filter is that while you want the speckle to be reduced you do not want to lose any valuable data.
Mean and median filters are examples of non-adaptive filters that can be used to remove the speckle appearance and the Frost and Gamma-Map filters are examples of adaptive filters. The adaptive filters can smooth speckled areas while preserving important detail.
Mean Filter
The Mean filter is a rather simple calculation for the computer. This process does not actually remove the speckled value but averages it into the summed data. It is important to note that averaging usually results in a general loss of detail, which is a good argument for using a small kernel window. This filter was applied to the Cape Breton Highland sub image to help enhance lineaments in the area such as the Eastern Highland Shear zone.
Median Filter
The Median filter is similar to the mean filter but slightly better. This technique handles the pixel values within the kernel window in a sequential order. The center pixel is then replaced by the value that is located in the middle of the sequential distribution.
Lee Filter
The Lee filter is based on the statistical distribution of DN values within the moving kernel, and using these values to determine what the center pixel value should be.
The filter assumes that the center pixel’s mean and variance are equal to the local mean and variance of all pixels within the user selected moving window. The Lee filter was applied to focus in on the fault lines and structural features from the Antigonish Highlands
Frost Filter
The Frost filter replaces the center pixel with a weighted sum of the surrounding values within a kernel window. The weighting factors decrease when larger kernels are used. The weighting factors increase for the center as variance within the kernel increases.
The synformal folding, the extensional graben structure and, the sedimentary geological features in the Whycocomagh area are more clearly emphasized after the frost filter was applied.
Gamma-Map Filter
The Gamma-MAP filter is an adaptive filter based on a noise model that contains non-stationary mean and variance parameters. This filter assumes that the original pixel value is between the value of the pixel of interest
and the kernel window average. This filter is good for filtering speckle but preserving detail. This filter was applied in the Canso area sub-image to make some of the bedrock detail stand out better.
Mosaics
Extensive coverage of a study area can be accomplished by overlaying adjacent images into a mosaic image. A mosaic image is basically a collection of images that are sewn together to create a much larger image. This is
an ideal technique of using real data to creating maps for large regions. ERDAS IMAGINE offers the user to join his/her RADARSAT images together producing what is known as a “seamless” mosaic.
This project involved four images that were mosaiced together to produce a virtual seamless image of Northern Nova Scotia and Cape Breton Island. The larger mosaiced image is more appealing to the human eye because it displays a region to which the user can relate.
This project only involved the production of a small-scale mosaiced image, but by developing this special skill could lead to larger seamless mosaicing projects. Large mosaics can help the geologist produce maps of regions that have never been mapped and/or regions that optical sensors can not penetrate. RADARSAT International has recently mosaiced almost the entire Republic of Indonesia. This project involved virtually hundreds of radar images put together to provide one large super image of the entire area. A I N T E G R
Conclusions
From this brief inquiry into the effectiveness of RADARSAT imagery for detecting geological features, within the ERDAS image handling software package, we have determined that the data is quite good. The two scenes of Standard beam 2 (S2) imagery provided an effective land coverage, that contribute much geological information. Due to the gentle rolling hills of much of Nova Scotia the S2 incidence angle was not casting many shadows or providing as much relief detection as would be encountered with an S7 image. S2 imagery when used in concert with Standard beam 7 offers an excellent combination for viewing topographic relief.
Lineament detection and lithological changes were detectable in portions of the image. When the amount of geological change was great enough to cause botanical or physical changes in the landscape the lithological changes were most apparent. The lineaments could be recognized because of their linear nature and the way that their edges can be detected
with edge enhancement algorithms.

The content above was taken from joint paper that I co-authored with Blair Sangster at COGS in March of 1999. The project also included a presentation that was presented at the Center of Geographic Sciences Auditorium, in Lawrencetown Nova Scotia and a large plotted poster.
In summation the use of S2 RADARSAT imagery for geological surveys is promising, however these studies would have to be broad in nature and likely supplemented with other remotely sensed data. S2 imagery could be used more effectively for regions with more pronounced relief where layover from a less steeply imaging sensor begins to distort the relief.

