Digital Elevation Models (DEMS)

A digital elevation model (DEM) or sometimes referred to as a digital terrain model (DTM) is a quantitative representation of the topography of the Earth. DEMs are used as a source of elevation (and to create other digital terrain models) for many different purposes

Color Shaded Relief Model – Gatineau, Quebec

This is one of several color shaded relief (CSR) models I created of Gatineau foot hills of Quebec. The city of Ottawa is featured in the national capital region near the bottom center of the image across the river just …

Color Shaded Relief Models – Pointe Du Chene, New Brunswick

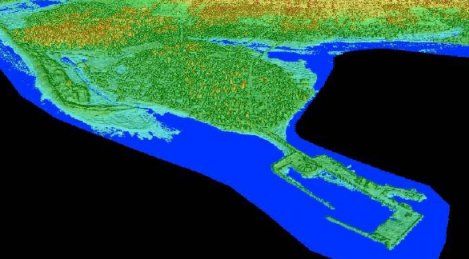
Color Shaded Relief Models of Pointe Du Chene, New BrunswickColor Shaded Relief Models of Pointe Du Chene, New Brunswick with flood
The above two images were created for my LIDAR flood modeling graduate research project. The first image is before the flood scenario; featuring a color shaded relief perspective view pointing south east from the Northumberland Strait landwards across the Pointe Du Chene wharf. The second image is of the same color shaded relief perspective view but features a 2.55 m flood level super imposed on top of it.

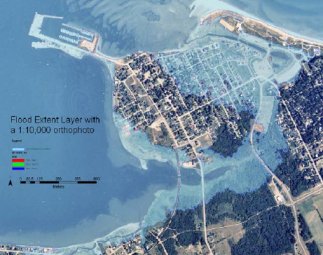
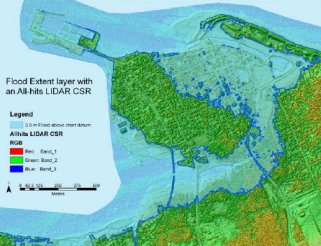
The 2.55 m flood level was an actual recorded storm surge water level that effected this area during a winter storm on January 2001. The two images below show the same flood level and area but from an overhead aerial view. The first image is with an orthophoto and the second image is with the color shaded relief.

Pointe Du Chene, New Brunswick with floodPointe Du Chene, New Brunswick with flood

Color Shaded Relief Model – Irvine, California

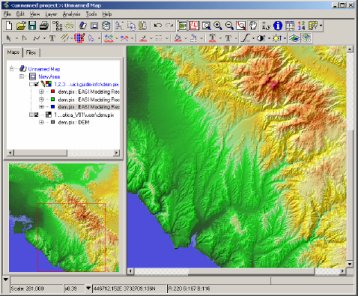
3D CSR Irvine California

The screen grab above was captured during the process of creating a color shaded relief model of Irvine, California. It was created in one of many demos I gave to clients while working for PCI Geomatics and was also used in the following tutorial that I created for the PCI geomatics website.

PCI Geomatics is a world leading developer of image centric geomatics software solutions. The PCI Geomatics flagship software, Geomatica, meets the growing demands of the remote sensing, GIS, cartography, and photogrammetry worlds. PCI Geomatics has long been recognized for offering high-value geomatics software solutions, advanced algorithms, excellent customer assistance, and product support for the widest range of spatial data formats in the industry.

Color Shaded Relief Model – Shediac, New Brunswick

Orthophoto & LIDAR CSR for New Brunswick

The two images above are of a portion of the small town of Shediac, New Brunswick. Each one is of the same spatial extent, however the one on the left is of an aerial photo of the town (1999) while the one on the right is a color shaded relief model created from high resolution LIDAR data (2003) using PCI Geomatica software. The LIDAR digital surface model (DSM) was part of a LIDAR flood modeling graduate research project.

Shediac is a small town located in eastern New Brunswick approximately 20 kilometers north of Moncton. The town calls itself the “Lobster Capital of the World”, hosts an annual lobster festival every July, and the world’s largest lobster sculpture is situated at the main entrance to town.

Cement Lobster in Shediac NewBrunswick Lobster Capital of the World

3D Perspective View Samples

Port Lorne, Nova Scotia

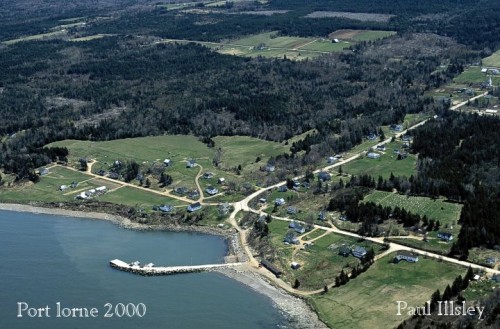
[*image source: PaulIllsley.com]

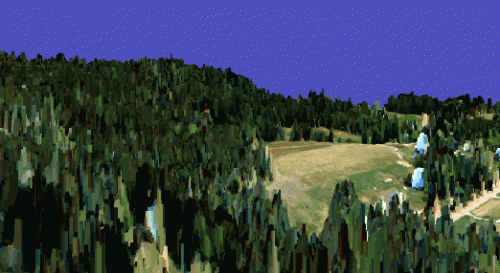
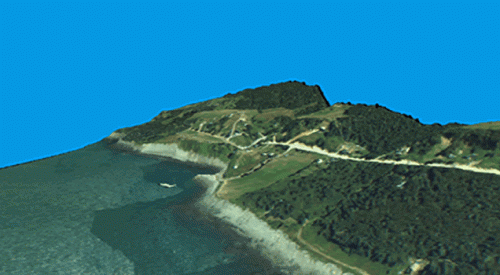
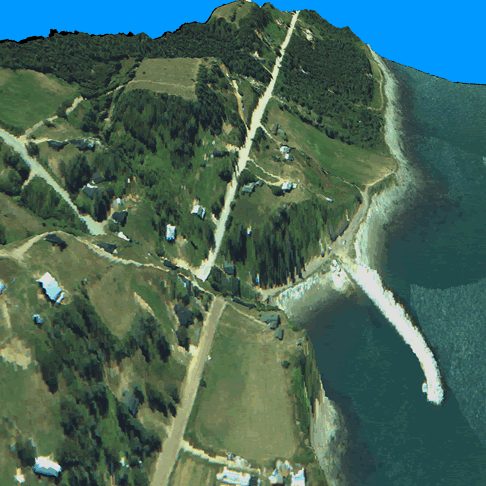
The following images are examples of perspective view models that were generated from a 2 meter LIDAR DEM integrated with 50 cm digital orthophotography of Port Lorne, Nova Scotia. Port Lorne is a coastal community along the Bay of Fundy with a relatively steep terrain so the images represent different perspective views depending on the source of origin and the direction that they are facing.

3D Perspective Views of Port Lorne, Nova Scotia

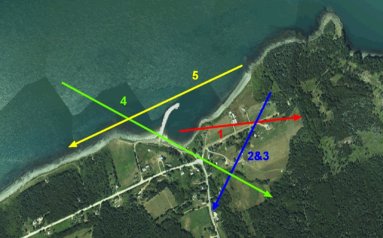
The colored arrows on the key image to the right represent the different perspective views that were generated from different locations and viewed along different directions (displayed in the images below). This image of the area also represents the traditional GIS view from above, as discussed above.

The first image below represents a perspective view (red arrow) of the area if it were viewed from the center of the image, above the wharf looking in an easterly direction.

3-D perspective view model of Port Lorne; Nova Scotia

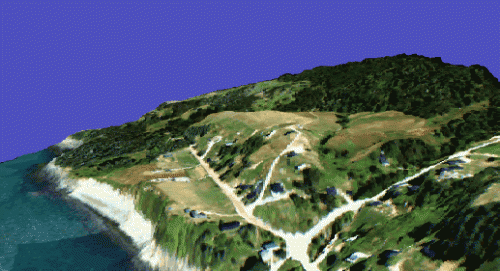
The next two images below represents a perspective view (blue arrow) of the area if it were viewed from the upper right hand corner of the original image in a south west direction. The images that demonstrate the same perspective but have different types of LIDAR DEMs integrated with them allowing them to portray different data within them.

3-D perspective view model of Port Lorne; Nova Scotia3-D perspective view model of Port Lorne; Nova Scotia


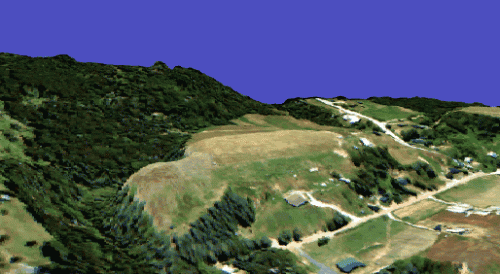
The next two images (first one represented with the green arrow, second one in blue) represents a perspective view of the area originated in the upper left hand corner of the image, but in slightly different directions.

3D Perspective Views of Port Lorne, Nova Scotia

3D Perspective Views of Port Lorne, Nova Scotia

More info on 3D Perspective Views

3D Perspective Views

3D perspective view of Cape George, Nova ScotiaMost imagery (and/or spatial data) that we view in geomatics is typically viewed vertically downwards from the source toward the map or image. This typical aerial view that we are accustomed to using, allows an abundant amount of information to be represented spatially within a two dimensional cartesian representation. However, occasionally it is useful for us to change our focus from the default traditional view and use a more complex three dimensional visualization view of the data.

This type of terrain model is commonly referred to as a perspective view and often reveals additional information by allowing us to observe the same data obliquely.. In order to do this each location of the image needs to be transformed from the traditional 2-D to a 3-D projection coordinate system.

A perspective view is not really a new tool as it has been around for centuries, but it has become a popular component of most geomatics projects. “A Perspective is a rational demonstration by which experience confirms that the images of all things are transmitted to the eye by pyramidal lines. Those bodies of equal size will make greater or lesser angles in their pyramids according to the different distances between the one and the other. By a pyramid of lines, means those which depart from the superficial edges of bodies and converge over a distance to be drawn together in a single point” (Leonardo da Vinci)¹.

Data integration and overlays are very common with perspective views because it allows traditional flat images to become new products by incorporating an elevation component and providing a new look at the same data. It is also probably used more so for visual appeal then as another method of extracting data.

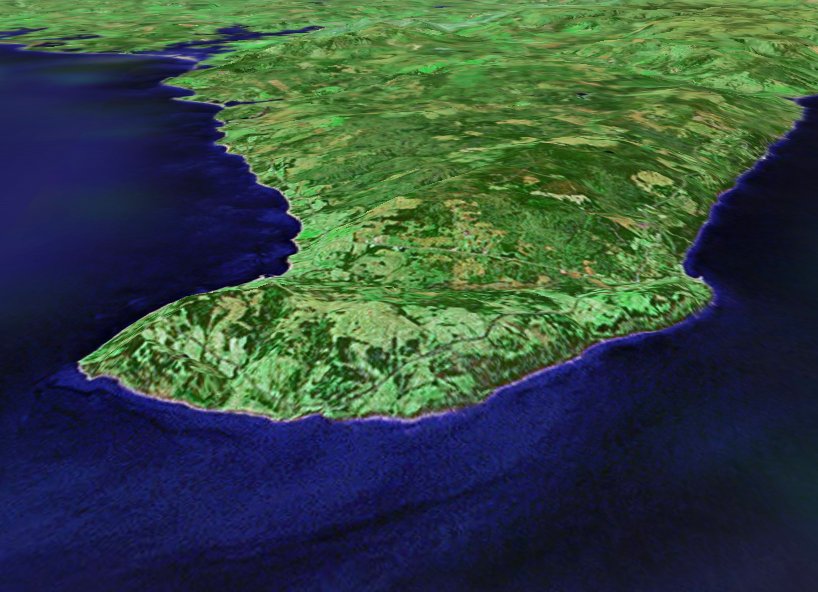
Sample image on the right is a 3D perspective view of Cape George, Nova Scotia (just north of Antigonish), created with LandSat imagery drapped over a digital elevation model (DEM).

[* quote 1 is from – O’Connor and Robertson (2003) Mathematics and art – perspective www-groups.dcs.st-and.ac.uk/~history/HistTopics/Art.htmlJanuary]

3D Perspective View Samples


3D Perspective View Related Links

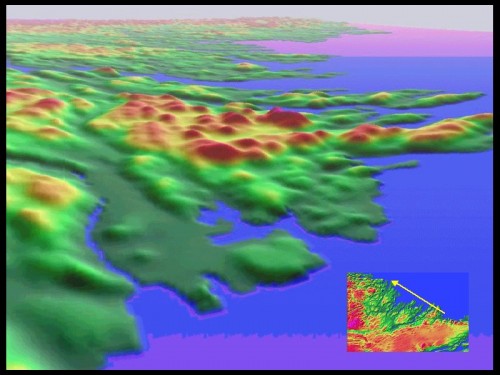
Color Shaded Relief Models – Makkovik, Labrador

Color Shaded Relief Models of Makkovik, Labrador Color Shaded Relief Models of Makkovik, Labrador

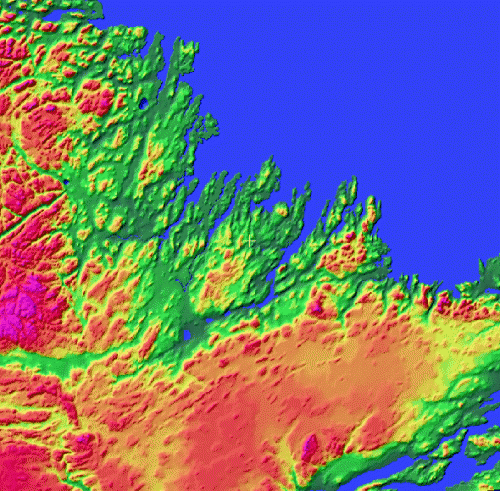
The above images are color shaded relief models that I created with a DEM of Makkovik, Labrador. These were part of a data integration project that I was involved with during my intense Remote Sensing training at the Center of Geographic Sciences (COGS) in Nova Scotia. the Makkovik region is a coastal area along the eastern coast of northern Canada that is rich with geologic outcrops.